Direct Access
Overview
Direct Access gives our customers the ability to access and query their data directly and securely through our data warehouse provider. Access can be granted one of two ways, either with a hosted account managed by Localytics or a customer hosted account if you are already a Snowflake customer.
Localytics Hosted Accounts
This type of account allows our customer to leverage our data warehouse account to access their data. You can access your data using either a secure web portal or using a JDBC/ODBC database connector. From there, you can perform SQL queries directly on your data without the need to setup your own account with our data warehouse provider, Snowflake. These accounts are subject to usage quotas. See metering section for more information.
Customer Hosted Accounts
Customers that are already using our data warehouse provider Snowflake may request that we grant access to their data from within their account. This allows our customers to leverage their own Snowflake account to access their data without the need to re-import the data into their data warehouse.
Metering
Customers that use Hosted Direct Access are
assigned their own warehouse for processing queries. Each warehouse is assigned a quota
which controls how many hours per month they can run.
Quota
All costs for compute resources are based on credits. When you signed up for hosted direct access, you purchased (or were granted) a quantity of hours and a warehouse size. Credits are charged based on the size of the warehouse and for how long they run.
Typically, customers are assigned a medium sized warehouse which consumes 4 credits per hour or 0.067 credits per minute. So if you are purchase 40 hours of a medium sized warehouse, your allocated quota at the start of the month would be 160 credits.
Warehouses are billed by the minute with a minimum charge of 1 minute. When a warehouse is suspended, it does not accrue any credit usage. Warehouses are automatically suspended after 10 minutes of inactivity. It's important to note that that every time you issue a query, the warehouse will be up for a minimum of 10 minutes. So even if your query only took 30 seconds to execute, your total warehouse billable time will be 10 minutes and 30 seconds.
Warehouse Size
Warehouses come in eight sizes. The size specifies the number of servers per cluster in the warehouse. There is a one-to-one correspondence between the number of servers in a warehouse cluster and the number of credits billed for each full hour that the warehouse runs. The following table show the relation between the warehouse size and the amount of credits it consumes per hour. Please divide this number by 60 in order to to get the credit usage by the minute.
| X-Small | Small | Medium | Large | X-Large | 2X-Large | 3X-Large | 4X-Large |
| 1 | 2 | 4 | 8 | 16 | 32 | 64 | 128 |
Monitoring Usage
There are several ways in which you can monitor your usage.
Monthly Quota
You can keep an eye on your monthly quota by executing the following SQL query in either the web portal or from your database connector. The row returned contains your monthly quota, and your used and remaining credits.| show RESOURCE monitors; |
Warehouse Load
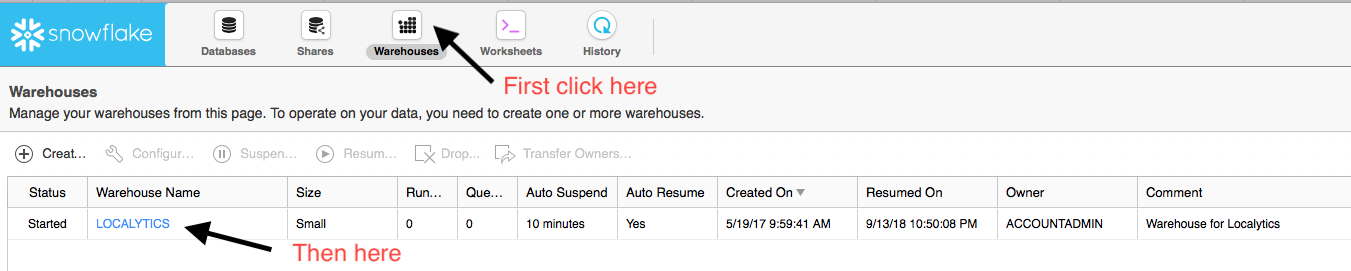
From the web portal, you can get a 15 day historical view of your warehouse activity and load. This may give you insights on how much processing you do on a daily basis. If you have a lot of small queries running often throughout the day, you may want to consider batching them up in order to optimize warehouse run time. If you have a lot of large queries running simultaneously or queries that are blocked by other queries, you may want to consider spreading them out. Insight into your warehouse load over time can help you optimize your queries so you are efficiently using your warehouse. You can view the warehouse load over time by:- Logging into the web portal
- Clicking on the "Warehouses" icon on the top left menubar
- Clicking on the "Warehouse Name" hyperlink
 For a more in depth analysis of your load usage, you can execute the following SQL query in either the
web portal or from your database connector. This will give you a breakdown of your load usage every
5 minutes for up to 15 days.
For a more in depth analysis of your load usage, you can execute the following SQL query in either the
web portal or from your database connector. This will give you a breakdown of your load usage every
5 minutes for up to 15 days.
|
SELECT * FROM TABLE(information_schema.Warehouse_load_history(date_range_start => Dateadd('day', -1, Current_timestamp()))); |
Warehouse History
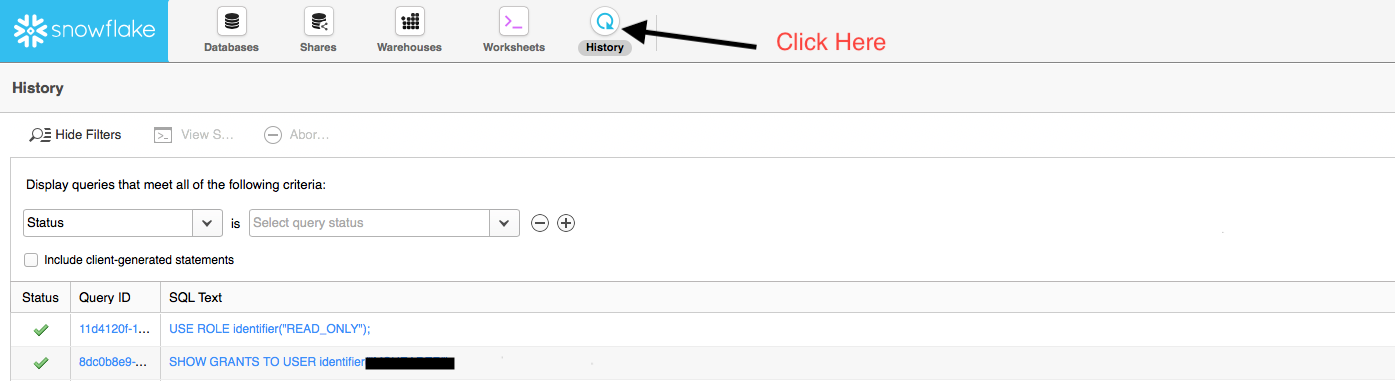
Once you have a better understanding of your warehouse load, you may need to drill down into the actual queries to get a better understanding of their total duration, their distribution over time or if they are blocked on other queries. You can view the history of the queries from the web portal by:- Logging into the web portal
- Clicking on the "History" icon on the top left menubar
 For a more in depth analysis of your queries, you can execute the following SQL query in either the
web portal or from your database connector. This will give you a breakdown of your queries for a date
range for up to 7 days.
For a more in depth analysis of your queries, you can execute the following SQL query in either the
web portal or from your database connector. This will give you a breakdown of your queries for a date
range for up to 7 days.
|
SELECT * FROM Table(information_schema.Query_history(Dateadd('hours', -1, CURRENT_TIMESTAMP()), CURRENT_TIMESTAMP())) ORDER BY start_time; |
References
For more information, consult the following docs:SQL Guide
Ready to start querying your data? Great! Check out the Localytics SQL Guide for recommendations on how to mine your data using SQL or a Business Intelligence tool.