Churn Correlations helps you understand why users stop coming back. Rather than scoring a single user, it looks across your entire user base to find the behaviors that most strongly separate users who churn from users who stay. Each behavior is ranked as a churn driver so you can see, at a glance, which actions matter most for retention.
Use Churn Correlations to:
- Identify the behaviors most closely associated with users churning.
- Quantify how much more likely users are to churn when they never perform a key behavior.
- Prioritize which behaviors to encourage—through messaging, onboarding, or product changes—to keep users engaged.
Important: Churn Correlations is calculated using a 90-day activity lookback. Only users who were active within the last 90 days are included in the analysis, and it's their behavior over that 90-day period that is evaluated against the churn window you select. Users with no activity in the last 90 days are not part of the calculation.
Availability: Churn Correlations is a gated feature that is enabled per organization. If you don't see Churn Correlations under Analytics, it may not be enabled for your organization—contact Support to learn more.
In this topic:
- Using the Churn Correlations dashboard
- Setting the churn window
- Understanding Churn Driver Rankings
- Reading a churn driver
- Confidence levels
Using the Churn Correlations dashboard
To work with the Churn Correlations dashboard:
-
Go to Analytics in the left pane and select Churn Correlations.
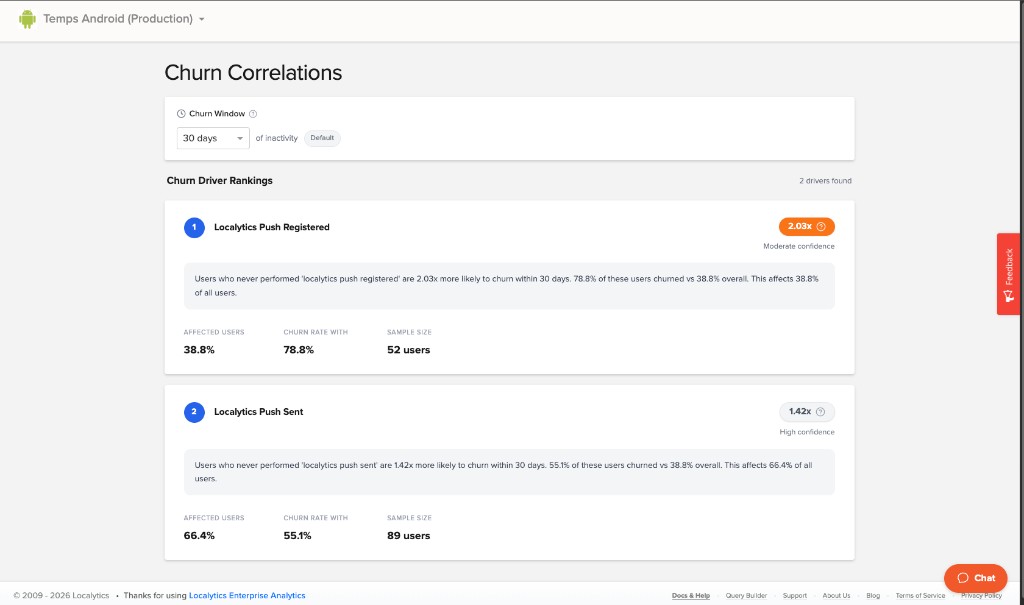
The Churn Correlations dashboard displays the Churn Window control at the top and the Churn Driver Rankings below it.
- Set the Churn Window to define how many days of inactivity mark a user as churned. For more information, see Setting the churn window.
- Review the ranked list of churn drivers to see which behaviors are most strongly correlated with churn. For more information, see Understanding Churn Driver Rankings.
Setting the churn window
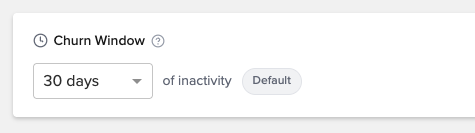
The churn window defines how many days of inactivity mark a user as churned. Localytics uses this window to classify every user as either churned or retained before calculating the churn drivers.
To set the churn window:
-
At the top of the dashboard, select the Churn Window dropdown.
-
Select the number of days of inactivity that should count as churn:
- 14 days of inactivity
- 30 days of inactivity (Default)
- 60 days of inactivity
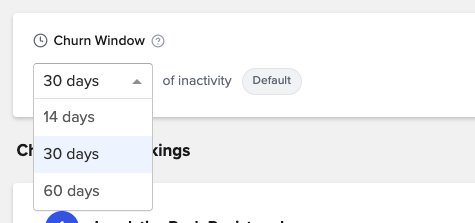
A shorter window (14 days) flags users as churned sooner and is useful for apps with frequent, habitual usage. A longer window (60 days) is better suited to apps that are used less often. Changing the window recalculates the rankings, so the drivers and their strengths may shift as you adjust it.
Understanding Churn Driver Rankings
The Churn Driver Rankings list the behaviors most strongly correlated with churn, ordered from the strongest driver to the weakest. The header shows how many drivers were found for the selected churn window.
Each row represents a single behavior, ranked so you can focus first on the drivers at the top of the list—the ones with the greatest impact on whether users churn.
Churn Correlations shows up to 20 ranked drivers for each churn window. It intentionally does not list every behavior—instead, it surfaces only the strongest, most meaningful drivers that pass its qualifying thresholds.
A behavior only appears as a driver when it meets a minimum bar of statistical relevance, including:
- A relative risk of at least 1.2x — users who never perform the behavior must be at least 1.2 times more likely to churn.
- At least 30 affected users — the behavior must apply to a large enough group to be reliable.
Note: If the app has insufficient data, or if no behaviors pass the qualifying thresholds for the selected churn window, no drivers are shown. If you see an empty result, try adjusting the churn window or allow more data to accumulate.
Reading a churn driver
Each churn driver card summarizes how a single behavior relates to churn.
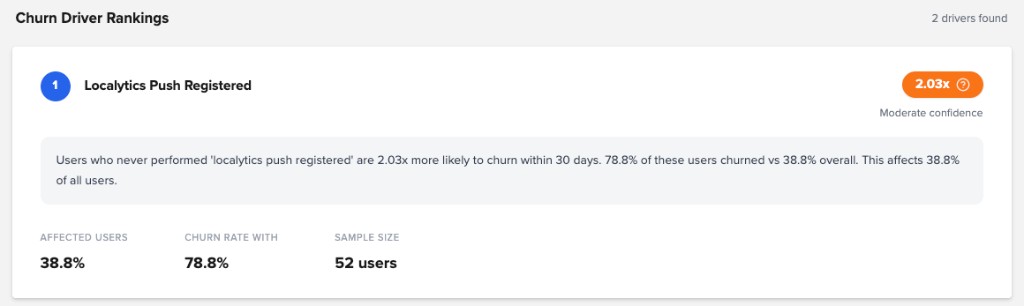
A card includes the following:
- Rank and behavior — the driver's position in the list and the behavior it describes (for example, Localytics Push Registered).
- Likelihood multiplier — how much more likely users are to churn when they never perform the behavior. For example, 2.03x means those users are just over twice as likely to churn.
- Summary — a plain-language explanation of the driver, such as “Users who never performed 'localytics push registered' are 2.03x more likely to churn within 30 days. 78.8% of these users churned vs 38.8% overall. This affects 38.8% of all users.”
- Affected Users — the percentage of all users that this driver applies to.
- Churn Rate With — the churn rate among the affected users. Compare this to the overall churn rate to see how much the behavior moves the needle.
- Sample Size — the number of users the calculation is based on. Larger samples generally produce more reliable results.
Confidence levels
Each driver is labeled with a confidence level that reflects how reliable the correlation is, based largely on the sample size and the strength of the relationship. Use confidence to decide how much weight to give a driver when planning retention efforts.
- High confidence — the correlation is well supported; you can act on it with a high degree of certainty.
- Moderate confidence — the correlation is meaningful but based on a smaller sample or a weaker signal; treat it as directional and confirm with additional analysis where possible.
Tip: A driver with a high multiplier but only moderate confidence is worth investigating—validate it before making major changes. A high-confidence driver that affects a large share of users is often the best place to start.